Prework - R Data Basics
Before you arrive at RMBL.
Intro to data structures, help pages, and variable types in R.
Overview
In this tutorial, you will learn how to use R to inspect the contents of a data frame or tibble. Data frames and tibbles are R’s structures for storing tabular data; if you inherit a tabular dataset in R, it will almost certainly come as one of these structures.
Here, you will learn how to do three things with data frames and tibbles:
- Look at the contents of a data frame or tibble
- Open a help page that describes a data frame or tibble
- Identify the variables and their types in a tibble
You will also meet the palmerpenguins and nycflights datasets. These datasets appear frequently in R examples.
The readings in this tutorial follow R for Data Science, sections 3.2 and 5.1.
Data frames
What is a data frame?
A data frame is a rectangular collection of values, usually organized so that variables appear in the columns and observations appear in rows.
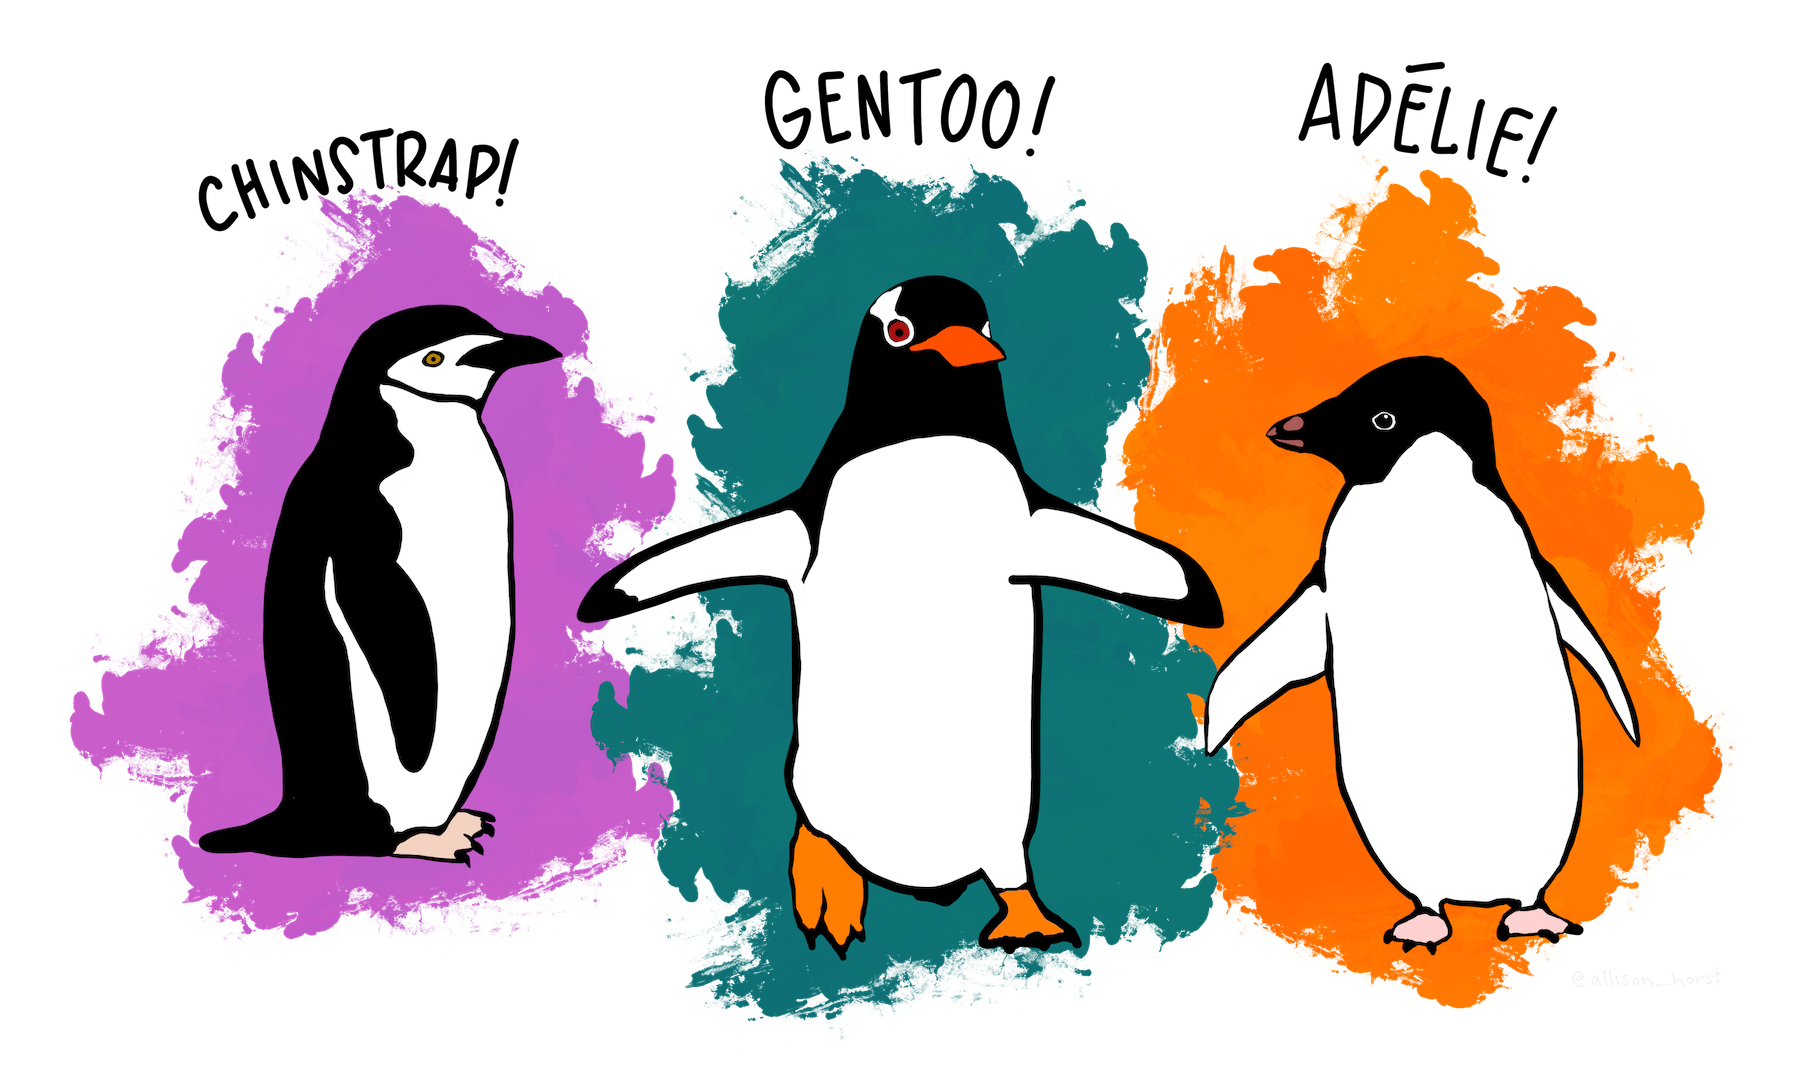
Here is an example: the penguins data frame contains observations collected and published by Dr. Kristen Gorman from Palmer Station, a long-term environmental research site in Antarctica. The data frame contains 344 rows and 8 columns. Each row represents a penguin, and each column represents a variable that describes the penguin. Each penguin is one of three different species.
Typing penguins into the R console prints the header of the penguins data frame.
## # A tibble: 344 × 8
##    species island    bill_length_mm bill_depth_mm flipper_length_mm body_mass_g
##    <fct>   <fct>              <dbl>         <dbl>             <int>       <int>
##  1 Adelie  Torgersen           39.1          18.7               181        3750
##  2 Adelie  Torgersen           39.5          17.4               186        3800
##  3 Adelie  Torgersen           40.3          18                 195        3250
##  4 Adelie  Torgersen           NA            NA                  NA          NA
##  5 Adelie  Torgersen           36.7          19.3               193        3450
##  6 Adelie  Torgersen           39.3          20.6               190        3650
##  7 Adelie  Torgersen           38.9          17.8               181        3625
##  8 Adelie  Torgersen           39.2          19.6               195        4675
##  9 Adelie  Torgersen           34.1          18.1               193        3475
## 10 Adelie  Torgersen           42            20.2               190        4250
## # ℹ 334 more rows
## # ℹ 2 more variables: sex <fct>, year <int>
A note about palmerpenguins
The code above worked because I’ve already loaded the palmerpenguins package in this tutorial: penguins comes in the palmerpenguins package. If you would like to look at penguins on your own computer, you will need to first load palmerpenguins. You can do that in two steps:
- Run
install.packages('palmerpenguins')to installpalmerpenguinsif you do not yet have it. - Load the package with the
library(palmerpenguins)command. - Run the command
data(package = 'palmerpenguins')to load thepenguinsdata frame into your R session.
After that, you will be able to access any dataset contained in the palmerpenguins package—until you close R.
One thing to notice
Did you notice how much information was inside penguins? Me too. Sometimes the contents of a data frame are hard to interpret. Let’s get some help with this…
Help pages
How to open a help page
You can learn more about penguins by opening its help page. The help page will explain where the palmerpenguins dataset comes from and what each variable in the penguins data frame describes. To open the help page, type ?penguins in the code chunk below and then click “Run Code”.
The ? syntax
You can open a help page for any object that comes with R or with an R package. To open the help page, type a ? before the object’s name and then run the command, as you did with ?penguins. This technique works for functions, packages, and more. If you want to specify getting help for a function or dataset in a particular package, you can use the :: operator. For example, ?dplyr::filter will open the help page for the filter() function in the dplyr package.
Notice that objects created by you or your colleagues will not have a help page (unless you make one).
Data types
Type codes
Let’s return to the penguins data frame. Run the code chunk below to see the first few rows of penguins again.
penguins
## # A tibble: 344 × 8
##    species island    bill_length_mm bill_depth_mm flipper_length_mm body_mass_g
##    <fct>   <fct>              <dbl>         <dbl>             <int>       <int>
##  1 Adelie  Torgersen           39.1          18.7               181        3750
##  2 Adelie  Torgersen           39.5          17.4               186        3800
##  3 Adelie  Torgersen           40.3          18                 195        3250
##  4 Adelie  Torgersen           NA            NA                  NA          NA
##  5 Adelie  Torgersen           36.7          19.3               193        3450
##  6 Adelie  Torgersen           39.3          20.6               190        3650
##  7 Adelie  Torgersen           38.9          17.8               181        3625
##  8 Adelie  Torgersen           39.2          19.6               195        4675
##  9 Adelie  Torgersen           34.1          18.1               193        3475
## 10 Adelie  Torgersen           42            20.2               190        4250
## # ℹ 334 more rows
## # ℹ 2 more variables: sex <fct>, year <int>
Did you notice that a row of three (or four) letter abbreviations appears under the column names of penguins? These abbreviations describe the type of data that is stored in each column of penguins:
-
intstands for integers. -
dblstands for doubles, or real numbers. -
chrstands for character vectors, or strings. -
dttmstands for date-times (a date + a time).
There are three other common types of variables that aren’t used in this dataset but are used in other datasets:
-
lglstands for logical, vectors that contain onlyTRUEorFALSE. -
fctrstands for factors, which R uses to represent categorical variables with fixed possible values. -
datestands for dates.
This row of data types is unique to tibbles and is one of the ways that tibbles try to be more user-friendly than data frames.